You are right, there are data analysis functions in the app as well as inside your account on the server, and they differ.
Inside the app, we provided all analysis features that are needed to analyze the arrows of the day as a support during your training and tuning sessions. Most important are basic statistical figures such as number of arrows, number of points achieved and so on. For grouping tests, the AGI is the relevant figure, see also this post: What is the AGI?. There are also special features available such the analysis views for the various tuning tests.
On your server account, there are all these features as well, but you can go back further into the history of your recorded arrows. Also, you can have a look at arrows from other archers, if they are sharing their data with you.
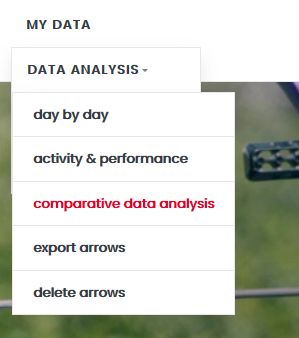
Archery Analytics has developed advanced data analysis features that allow to analyze developments over longer periods of time. You can track your performance and compare various aspects, such as how the vertical and horizontal dispersions depend on the shooting distance. You can try those advanced features using the demo account. Log in as user RyngDyng and with password 123demo123. You’ll find more items inside the data analysis menu:

- activity and performance: long-term development and activity monitoring
- comparative data analysis: find out how your performance is influenced by factors such as distance, type of target face, and many more
In case you are interested in using these advanced features for your data as well, just get in contact with the AA staff.
If you are interested in the details of the statistical numbers and how they relate to the various aspects in archery such as tuning of equipment or faults in shooting style, we recommend our White paper Tuning and Data Analysis.